 Hemoglobin is the prototypical cooperative protein. It contains 4 subunits: 2 alpha and 2 beta. The alpha and beta
subunits bear similar sequences and VERY similar structures. This allows us to speak about hemoglobin as if it contains
4 identical subunits in terms of Cooperativity. Myoglobin, even though it carries the same function
(bind oxygen) and bears a very similar structure to a hemoglobin subunit does not display Cooperativity because it is
a monomeric protein.
Hemoglobin is the prototypical cooperative protein. It contains 4 subunits: 2 alpha and 2 beta. The alpha and beta
subunits bear similar sequences and VERY similar structures. This allows us to speak about hemoglobin as if it contains
4 identical subunits in terms of Cooperativity. Myoglobin, even though it carries the same function
(bind oxygen) and bears a very similar structure to a hemoglobin subunit does not display Cooperativity because it is
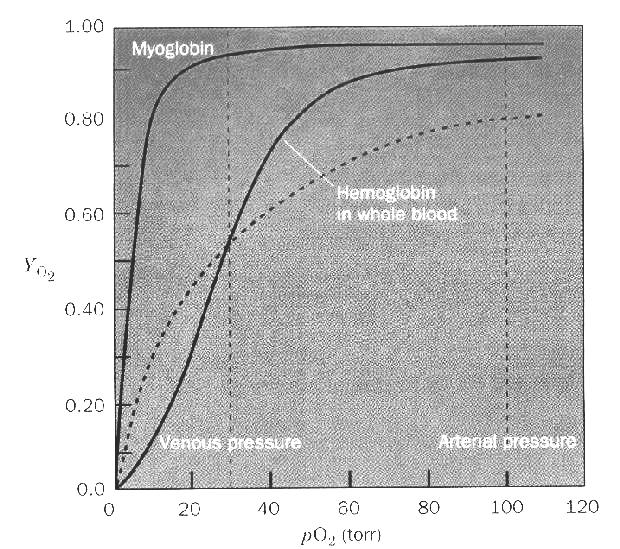
a monomeric protein.The Solid hyperbolic curve represents the binding of oxygen to myoglobin as [O2] changes. The sigmoidal curve represents oxygen binding to hemoglobin as [O2] changes. There are two dashed vertical lines in the plot that represent the [O2] in the lungs (right most line) and [O2] in the tissues (left most line).
If hemoglobin acted like myoglobin we would suffocate rather quickly!
Furthermore the hemoglobin line is with 2,3 bisphosphoglycerate (2,3BPG) in the blood. With out 2,3 BPG the hemoglobin line shifts left about 40%.... Cooperative binding like that displayed by the sigmoidal curves requires that the protein exhibits two distinct conformations. One with a relatively high KD (labeled "T" or "poor" state) and one with a relatively low KD (labeled "R" or "Good" state). The two forms exist in a dynamic equilibrium with the the "T" dominating in the substrate free form. As Substrate concentration increases the "R" form becomes dominant due to the shifting equilibrium.
What are these structural changes and how does it affect Cooperativity. Select the radio buttons above to see animations of hemoglobin structures in the GOOD and POOR structural forms.