The two pictures at the top represent the same structures
with two different models. The first is a space filling model demonstrating
the amount of space required for each atom. The second is a stick model
to help you see the angles as you rotate the bonds. You may select to rotate
either Phi or Psi. The currently select angle is also displayed on the
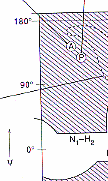
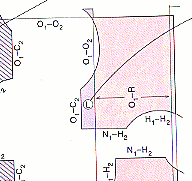
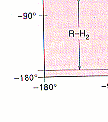
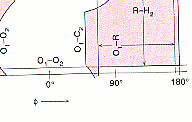
plot of Phi vs. Psi. On the Phi/Psi plot..... The regions that are
white are ANY allowed for any amino acid. The pink regions are Phi/Psi
angles that are not allowed for all those amino acids which have a b-Carbon
(ie. all but glycine).
Notice: the pink regions are symmetrically placed
across the graph while the dark purple one are assymmetrical! The Dark
purple regions are those that ARE allowed for all amino acids except proline.
In Proline Phi is restricted to angles of about -60 degrees while Psi is
"freely rotatable".In the pink regions indications such as "<--- R-O1--->
mean that The b carbon of the side chain and the oxygen atom of the amide
collide in this region. Look for these collisions on the pictures as you
rotate the bonds.As you change the angles, a blue bar represents a rough
idea of where you are on the plot.The circle on the plot labeled "a" represents
the angles that when several consecutive amin acids have these angles an
a-helix structure is observed.
the circles labeled "A" and "P" represent the angles that when several
consecutive amin acids have these angles an b-sheet structure is observed. |


